


Last updated: November 7, 2026
Reviewed by a certified public accountant (CPA) on November 10, 2026.
Gross margin is the portion of revenue left once you’ve paid the direct cost of what you sell. Bring in $500,000 with $300,000 in product or delivery costs, and your gross margin is 40%. That 40% has to pay for rent, salaries, marketing and profit.
Short answer: Gross margin = (Revenue minus cost of goods sold) / Revenue. A business with $500,000 in revenue and $300,000 in cost of goods sold earns $200,000 of gross profit, a 40% gross margin. Margin isn’t markup: a 50% markup on cost yields just a 33.3% gross margin.
Key takeaways
- Gross margin gauges pricing power and production efficiency before overhead comes in.
- Across the U.S. market, the average gross margin stood at 37.76% in NYU Stern professor Aswath Damodaran’s January 2026 data.
- The same data reveals enormous gaps: roughly 72% for software and pharmaceuticals, roughly 26% for grocery retail and roughly 10% for auto and truck makers.
- To convert markup to margin, use: margin = markup / (1 + markup).
- A 5% price increase usually adds more gross profit dollars than a 5% cost cut, even when the resulting margin percentages look alike.
Table of Contents
What gross margin measures
It answers a narrow question: once you’ve paid for what went directly into the things you sold, how much of each sales dollar remains? It leaves out overhead like office rent, admin salaries and advertising, on purpose. That isolates two things you can influence fairly directly: what you charge and what it costs to make or buy what you sell.
A falling margin is usually an early warning sign. Suppliers may have raised prices, discounts may have crept up, the product mix may have tilted toward cheaper lines, or waste and returns may have climbed. Since it reacts quickly, many owners check it monthly, long before the full profit and loss tells the same story.

Gross margin formula
Gross profit = Revenue minus Cost of goods sold (COGS)
Gross margin = Gross profit / Revenue
Use net revenue, meaning sales after returns, allowances and discounts. Gross sales inflate the margin.
Example
A specialty coffee roaster sells $500,000 of coffee in a year. Green beans, packaging, roasting labor and freight-in add up to $300,000.
- Gross profit = $500,000 minus $300,000 = $200,000
- Gross margin = $200,000 / $500,000 = 40%
That leaves 40 cents of every sales dollar to cover everything else and, eventually, profit.
Gross margin vs. gross profit vs. net margin
| Measure | Formula | What it tells you |
|---|---|---|
| Gross profit | Revenue minus COGS | Dollars left after direct costs |
| Gross margin | Gross profit / Revenue | The same thing as a percentage, comparable across periods |
| Operating margin | Operating income / Revenue | What’s left after overhead too |
| Net margin | Net income / Revenue | The bottom line after interest and taxes |
| Contribution margin | Revenue minus all variable costs | What each sale contributes to fixed costs |
People often swap gross profit and gross margin in conversation, and “gross profit margin” means exactly the same as gross margin. In reports, keep the dollar amount and the percentage separate.
Margin vs. markup: the conversion table
This mix-up costs small businesses more than any other. Markup is figured on cost, while margin is figured on price. An item that costs $100 and sells for $150 carries a 50% markup but only a 33.3% margin.
| Markup on cost | Resulting gross margin |
|---|---|
| 25% | 20.0% |
| 33.3% | 25.0% |
| 50% | 33.3% |
| 75% | 42.9% |
| 100% | 50.0% |
| 150% | 60.0% |
| 200% | 66.7% |
The formulas:
- Margin = Markup / (1 + Markup)
- Markup = Margin / (1 minus Margin)
To reach a 40% gross margin, you need a markup of roughly 66.7% on cost, not 40%.
Gross margin by industry (January 2026)
These figures only mean something against the right benchmark. NYU Stern professor Aswath Damodaran publishes margin data by industry for U.S. companies, and his January 2026 dataset shows just how wide the range runs:
| Industry (U.S. public companies) | Gross margin | EBITDA / Sales |
|---|---|---|
| Software (system and application) | 71.72% | 35.93% |
| Drugs (pharmaceutical) | 71.73% | 33.59% |
| Semiconductor | 58.97% | 36.77% |
| Apparel | 56.88% | 11.47% |
| Retail (general) | 33.18% | 10.11% |
| Restaurant and dining | 32.24% | 19.47% |
| Retail (grocery and food) | 26.31% | 5.40% |
| Construction supplies | 25.52% | 19.46% |
| Trucking | 21.19% | 15.58% |
| Auto and truck | 10.41% | 7.49% |
| Total market | 37.76% | 16.56% |
Two lessons stand out. First, a high gross margin doesn’t promise a strong bottom line: apparel companies keep about 57% after product costs but far less after marketing, stores and overhead. Second, these are public companies, many of them huge. A small business in the same field may have a different cost structure, so use the table as a sanity check, not a target.

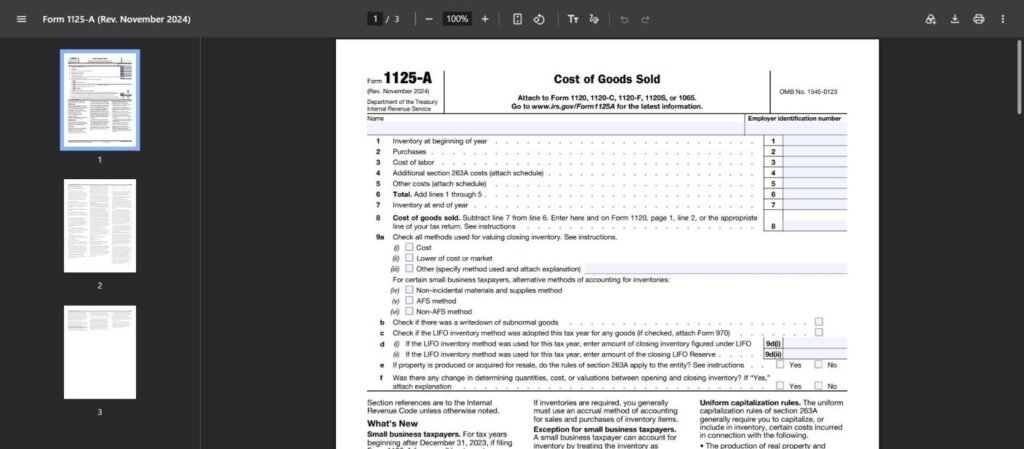
What belongs in cost of goods sold
The figure is only as reliable as the COGS number underneath it. What goes in varies by business:
- Product sellers and manufacturers: materials, direct labor, freight-in and production overhead like factory utilities and equipment depreciation.
- Retailers and distributors: the purchase cost of goods sold, freight-in, plus inventory shrink and write-downs.
- Service businesses: the labor and contractor costs of delivering the service, plus materials used on jobs.
- Software companies: hosting, third-party software built into the product, payment processing tied to sales and the customer support and onboarding required to deliver the service.
What stays out: sales commissions, marketing, office rent, admin salaries and general software subscriptions, which are operating expenses. Shifting costs between COGS and overhead changes the margin without changing profit, which is why consistent classification matters more than any one choice.
Price increase or cost cut? A worked comparison
Begin with the roaster: $500,000 of revenue, $300,000 of COGS and a 40% margin.
- Raise prices 5% (with volume unchanged): revenue rises to $525,000, gross profit to $225,000 and margin to 42.9%. Gross profit goes up $25,000.
- Cut COGS 5%: COGS falls to $285,000, gross profit rises to $215,000 and margin to 43.0%. Gross profit goes up $15,000.
The margin percentages are nearly the same, yet the price increase delivers $10,000 more gross profit. That’s why pricing tends to be the most powerful lever, provided customers stick around. Software vendors understand this well; Atlassian’s recent Jira price increase is one case of a company leaning on price.
Building a price from a target margin
Most small businesses price by adding a markup to cost. Working back from the margin you need is more dependable, since it links pricing straight to what overhead and profit demand.
Price = Unit cost / (1 minus Target margin)
Suppose a bag of coffee costs the roaster $9.00 to make and the target is 40%:
- Price = $9.00 / 0.60 = $15.00
- Check: ($15.00 minus $9.00) / $15.00 = 40%
Now suppose the roaster decides it needs 45% to cover a new lease. The price becomes $9.00 / 0.55 = $16.36. That’s a 9% price increase for five extra points of margin, exactly the kind of trade-off owners should see in numbers before committing to it.
Run this for each main product. Some lines will clear the target comfortably and some won’t, and the gap shows you where to raise prices, trim costs or stop selling.
Service and software businesses
For service firms, people are the main delivery cost, so the margin hinges on utilization: the share of paid hours that get billed. A consultancy paying staff for 40 hours a week but billing 25 has a very different margin from one billing 32, even at the same hourly rate.
Software companies top the January 2026 table at roughly 72%, since serving one more customer costs little. At some companies, that figure is under strain. Hosting, third-party services and, more and more, the computing cost of AI features all land in cost of revenue. A software business adding AI-heavy features should watch whether cost of revenue is growing faster than its prices.
How inventory accounting changes the number
For businesses that carry stock, the inventory method affects cost of goods sold and therefore the margin. When purchase costs are climbing, FIFO (first in, first out) charges older, cheaper costs to COGS first, which yields a higher reported margin. LIFO (last in, first out) charges the newest, pricier costs first, which lowers the reported margin and often taxable income too.
The method doesn’t change the cash you earned, but it changes what the margin appears to say. When comparing yourself with a company on a different inventory method, adjust before drawing conclusions.
Reading a competitor’s margin
Public companies report revenue and cost of revenue in the annual reports (Form 10-K) they file with the SEC, so you can work out their figure in a minute. Two caveats: companies classify costs differently, with some putting shipping or support in operating expenses instead of cost of revenue, and big companies buy at prices a small business can’t get. Use competitor figures to understand the market, not as a goal for next quarter.
7 ways to improve gross margin
- Revisit prices at least yearly and try increases on new customers first.
- Tilt the mix toward higher-margin products or services through placement, bundles or sales incentives.
- Renegotiate supplier terms, volume discounts and freight included.
- Reduce waste, spoilage and shrink with more accurate inventory counts and better storage.
- Rein in discounting. Track discounts by salesperson and channel, since they tend to grow quietly.
- Cut returns by fixing what causes them, like product descriptions or quality problems.
- Standardize delivery for services so each job takes fewer hours.
Tracking gross margin month to month
Calculate it every month, and by product line or customer group wherever your books allow. A blended margin can hold steady while one line improves and another falls apart.
Look out for two technical traps. Incorrect month-end inventory counts feed errors directly into COGS, so a margin swing might be a counting issue, not a business one. And if you change how inventory is valued or which costs go into COGS, restate earlier months on the same basis before comparing.

A monthly margin review in 5 questions
Add these five questions to every month-end review. With a product-level report, they take ten minutes:
- Did the overall margin shift by more than a point? If it did, find out why before anything else.
- Which product or service line moved most? A blended figure conceals the cause.
- Did average selling prices change? Look for new discounts, promotions or a move to lower-priced channels.
- Did unit costs change? Check the latest three supplier invoices for your biggest items, along with any freight surcharges.
- Can you trust the inventory count? A big swing without an obvious business reason is often a counting or cut-off mistake.
Record the answers. After six months you’ll have a history of what really drives your margin, which beats any benchmark.
A healthy margin doesn’t guarantee cash
Gross profit is an accounting number, while cash comes down to timing. A distributor can earn a 30% margin on every sale and still run low on cash because it pays suppliers in 30 days, collects from customers in 60 and builds inventory before a busy season.
So pair the margin with two cash measures: how long inventory sits before it sells and how long customers take to pay. If either one is stretching out, a good margin can still leave the bank account thin.
Common gross margin mistakes
- Mixing up markup and margin when pricing.
- Using gross sales rather than net sales after returns and discounts.
- Leaving freight-in or direct labor out of COGS, which pumps up the margin.
- Benchmarking against the wrong industry or companies of a very different size.
- Tracking only the blended margin instead of product or customer margins.
Two pricing questions owners ask
What’s the difference between gross margin and contribution margin?
Gross margin subtracts only cost of goods sold, which can include some fixed production costs. Contribution margin subtracts every variable cost, sales commissions and outbound shipping included, but no fixed costs. Gross margin fits financial reporting, while contribution margin fits pricing and break-even decisions.
Should I use gross margin or markup when quoting prices?
Quote from a target margin, then convert to markup only if your system requires it. Starting from margin keeps prices tied to the overhead and profit the business has to cover.
Our Take / Expert Perspective
Our take: this is the number most owners should look at before revenue. Revenue shows how busy you are; margin shows whether all that busyness pays. A business growing 30% a year while its margin slips is often working harder for the same money.
The January 2026 industry data also shows why copying a competitor’s prices is risky. Two companies in the same sector can have very different cost structures, and the lower-cost one can hold prices that would sink the other. Know your own margin by product before matching anyone’s price.
Recent years of inflation have changed the math as well. When supplier prices climb faster than customer prices, margin wears away in small steps that are easy to overlook month to month. Forecast, not fact: businesses that review prices on a set schedule, rather than in a crisis, will probably defend margin better through the next round of cost increases.
Our recommendation: set a target gross margin for every main product or service, build prices from it using the markup-to-margin conversion and compare actual margins with that target each month.
Frequently Asked Questions
What is a good gross margin?
That depends on the industry. Damodaran’s January 2026 data puts the average for the total U.S. market at 37.76%, with software near 72% and grocery retail near 26%. Compare your margin with your own history and with similar businesses, not with unrelated industries.
Is gross margin the same as gross profit margin?
Yes. Both mean gross profit divided by revenue, shown as a percentage. Gross profit alone is the dollar figure.
How do you calculate gross margin from markup?
Divide the markup by one plus the markup. A 50% markup gives 0.5 / 1.5 = 33.3% margin, and a 100% markup gives a 50% margin.
Does gross margin include labor?
It includes direct labor, meaning the labor that makes the goods or delivers the service. It leaves out administrative, sales and management salaries, which are operating expenses.
Why is my gross margin different from last month’s?
Typical causes are price changes, supplier cost increases, a shift in product mix, discounts, returns or inventory count errors. Break the margin out by product to pinpoint the cause.
Can gross margin be negative?
Yes, when cost of goods sold is higher than revenue. That means every sale loses money before any overhead, which usually points to pricing below cost, a costing error or a one-time write-down.
This article is for general information only and is not tax, accounting or financial advice. Consult a licensed CPA or financial professional for your situation.
Sources
- Aswath Damodaran, NYU Stern: Operating and net margins by industry (US), January 2026, checked November 7, 2026
- aiandblog: Jira pricing and the Atlassian price increase and our Editorial Policy
Photos: Clay Banks, Vitaly Gariev, Michael Krahn and Muhammad-Taha Ibrahim on Unsplash.









Leave a Reply