


Last updated: November 7, 2026
Reviewed by a certified public accountant (CPA) on November 10, 2026.
A chart of accounts is the numbered list of every account a business uses to record transactions: assets, liabilities, equity, revenue and expenses. Set it up well and your reports answer real questions in seconds; set it up badly and you’ll spend each month-end recategorizing the same transactions.
Short answer: A chart of accounts (COA) is the master list of account names and numbers in your general ledger, sorted into five types: assets, liabilities, equity, revenue and expenses. Most small businesses need 40 to 100 accounts, numbered in ranges like the 1000s for assets and 6000s for operating expenses, with expense accounts that line up cleanly with tax return lines.
Key takeaways
- Each account falls into one of five types, and the type determines whether it shows up on the balance sheet or the income statement.
- Number accounts in ranges with gaps so new ones slot in without renumbering.
- Mapping expense accounts to Schedule C lines (lines 8 to 27 for 2025) saves sole proprietors and single-member LLCs hours at tax time.
- Use classes, locations or tags for departments and projects rather than duplicating accounts.
- A few clear accounts beat lots of vague ones, and “miscellaneous” should hover near zero.
Table of Contents
What a chart of accounts is for
The chart of accounts is the framework behind your bookkeeping. Whenever you categorize a bank transaction, create an invoice or enter a bill, you’re picking an account from this list, and your reports are only as good as those picks.
A well-designed chart handles three jobs:
- It organizes the books so the balance sheet and income statement come out in a sensible order.
- It informs decisions by separating the costs and revenue streams you actually manage.
- It speeds up tax prep by matching the categories on your return.
The list itself is just names and numbers. Activity gets recorded in the general ledger, where each account in the chart keeps its own running balance.
The five account types
| Type | Normal balance | Typical number range | Statement |
|---|---|---|---|
| Assets | Debit | 1000 to 1999 | Balance sheet |
| Liabilities | Credit | 2000 to 2999 | Balance sheet |
| Equity | Credit | 3000 to 3999 | Balance sheet |
| Revenue | Credit | 4000 to 4999 | Income statement |
| Cost of goods sold | Debit | 5000 to 5999 | Income statement |
| Operating expenses | Debit | 6000 to 7999 | Income statement |
| Other income and expense | Varies | 8000 to 9999 | Income statement |
Cost of goods sold and other income are technically subgroups of expenses and revenue, but giving them their own number ranges lets you read gross margin and operating income right off the report without a separate spreadsheet. No legal standard dictates these ranges; they’re a common convention that most accounting software uses by default.
Chart of accounts template for a small business
Here’s a starter template for a small service or light-product business. Remove what you don’t need and add only what you’ll genuinely report on.
| Number | Account | Type |
|---|---|---|
| 1000 | Checking account | Asset |
| 1010 | Savings account | Asset |
| 1050 | Undeposited funds | Asset |
| 1100 | Accounts receivable | Asset |
| 1200 | Inventory | Asset |
| 1300 | Prepaid expenses | Asset |
| 1500 | Equipment | Asset |
| 1510 | Accumulated depreciation, equipment | Asset (contra) |
| 1600 | Vehicles | Asset |
| 2000 | Accounts payable | Liability |
| 2100 | Credit card payable | Liability |
| 2200 | Payroll liabilities | Liability |
| 2300 | Sales tax payable | Liability |
| 2400 | Deferred revenue | Liability |
| 2700 | Long-term loan | Liability |
| 3000 | Owner’s capital or common stock | Equity |
| 3100 | Owner’s draws or distributions | Equity (contra) |
| 3900 | Retained earnings | Equity |
| 4000 | Service revenue | Revenue |
| 4100 | Product sales | Revenue |
| 4900 | Discounts and refunds given | Revenue (contra) |
| 5000 | Cost of goods sold | Cost of goods sold |
| 5100 | Subcontractors for client work | Cost of goods sold |
| 6000 | Advertising and marketing | Expense |
| 6100 | Bank and payment processing fees | Expense |
| 6200 | Insurance | Expense |
| 6300 | Legal and professional fees | Expense |
| 6400 | Office supplies | Expense |
| 6500 | Rent | Expense |
| 6600 | Software subscriptions | Expense |
| 6700 | Wages and salaries | Expense |
| 6710 | Payroll taxes | Expense |
| 6800 | Travel | Expense |
| 6810 | Meals | Expense |
| 6900 | Utilities and phone | Expense |
| 7000 | Depreciation | Expense |
| 8000 | Interest income | Other income |
| 9000 | Interest expense | Other expense |
That’s fewer than 40 accounts, enough for the everyday needs of a typical small firm. Note the gaps between numbers, like 1010 to 1050 and 6100 to 6200, which let you insert accounts later in the right spot.
Numbering your accounts
A good numbering scheme is dull and predictable. A few rules that hold up as businesses grow:
- Use four digits for most small and mid-sized businesses. Five or six digits only make sense for multi-entity groups that build departments into the number.
- Reserve the first digit for the type. Anyone reading a report should know that 6xxx means an operating expense.
- Leave gaps of 10 or 100 between accounts at the same level.
- Keep related accounts together. Place payroll taxes (6710) right after wages (6700) so they appear side by side on reports.
- Don’t recycle numbers for new purposes over time. When you retire an account, mark it inactive instead of renaming it.
Mapping expense accounts to Schedule C
Sole proprietors and single-member LLCs report business income and expenses on Schedule C. The IRS instructions for the 2025 Schedule C arrange expenses across lines 8 through 27. Mapping your accounts to those lines turns tax preparation into a quick handoff:
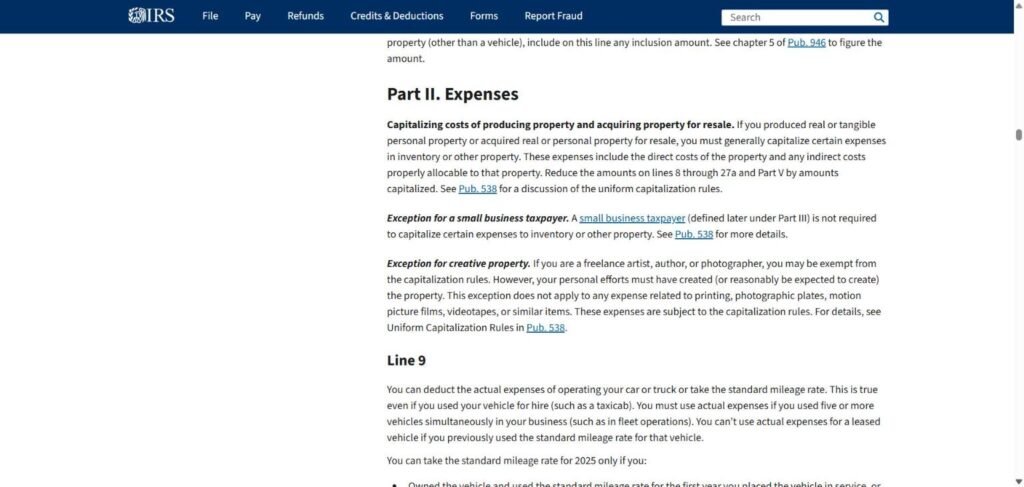
| Schedule C line | Topic | Template account |
|---|---|---|
| 8 | Advertising | 6000 Advertising and marketing |
| 9 | Car and truck expenses | Vehicle expense account, if you track actual costs |
| 10 | Commissions and fees | 6100 Bank and payment processing fees, if you treat them as fees |
| 11 | Contract labor | Contractor expense (not client-billable subcontractors in COGS) |
| 13 | Depreciation and section 179 | 7000 Depreciation |
| 15 | Insurance (other than health) | 6200 Insurance |
| 16b | Other interest | 9000 Interest expense |
| 17 | Legal and professional services | 6300 Legal and professional fees |
| 18 | Office expense | 6400 Office supplies, 6600 Software subscriptions |
| 20b | Rent or lease of other business property | 6500 Rent |
| 23 | Taxes and licenses | 6710 Payroll taxes, plus a licenses account |
| 24a and 24b | Travel; deductible meals | 6800 Travel; 6810 Meals |
| 25 | Utilities | 6900 Utilities and phone |
| 26 | Wages | 6700 Wages and salaries |
When an account could fit on two lines, settle the mapping with your tax preparer once and record it. Corporations and partnerships file different forms, so their mapping follows those returns, but the idea is the same.

Naming conventions that prevent miscoding
Account names do more work than numbers, since they’re what people see when categorizing a transaction. A few conventions keep a chart of accounts easy to read:
- Name the category, not the vendor. “Software subscriptions,” not “Adobe.” Vendors come and go; categories stay.
- Lead with the general word. “Insurance, general liability” and “Insurance, workers’ compensation” then sort next to each other.
- Skip abbreviations that only one person understands.
- Label contra accounts clearly, like “Accumulated depreciation, equipment” or “Sales returns and refunds.”
- Keep tense and style consistent throughout, so the list reads like a single document rather than notes from several people.
How to set up a chart of accounts in 7 steps
- List the reports you need. Begin with the questions you ask every month, like profit by service line or marketing spend by channel.
- Begin with your software’s default list for your industry. Most programs provide one, and trimming it beats building from nothing.
- Delete or deactivate accounts you’ll never touch. Fewer options mean fewer miscoded transactions.
- Add accounts for anything you want to see on its own in the income statement, like subcontractors or software.
- Map expenses to tax return lines together with your preparer.
- Decide what belongs in classes or tags rather than accounts: locations, departments, projects and owners.
- Write a one-page coding guide telling whoever categorizes transactions which account to use for common items.
Accounts vs. classes, locations and tags
The most common way a chart of accounts swells is by using accounts for things that aren’t account types. “Rent, Denver office” and “Rent, Austin office” are the same kind of expense in two places. Keep a single rent account and tag each transaction by location. Your income statement stays short, and you can still pull a report by location whenever you want.
The same goes for projects, departments, product lines and owners. As a rule of thumb, if you’d want the same split across many accounts, it belongs in a class or tag, not an account.
Industry variations worth knowing
- Retail and e-commerce: split product sales by channel when margins differ, and give merchant fees, shipping and returns their own accounts.
- Construction and trades: cost of goods sold typically needs materials, subcontractors, equipment rental and job labor, with job costing handled through projects or classes.
- Software and SaaS: separate subscription revenue from services revenue, and keep hosting and third-party software used to deliver the product in cost of revenue.
- Nonprofits: charts are built around funds, restrictions and functional expenses, and many start from a standardized nonprofit chart.
Cleaning up an existing chart of accounts
Inherited books frequently carry 200 accounts where 60 would be plenty. A safe order for cleaning up:
- Run an activity-by-account report covering the past 12 months.
- Flag accounts with no activity and set them to inactive.
- Merge duplicates by moving transactions into the account you’re keeping, ideally at the start of a fiscal year so comparisons stay clean.
- Rename vague accounts like “Miscellaneous” or “General expense,” and recode what’s in them.
- Renumber only if you have to, and keep a map from old numbers to new ones.
- Let your tax preparer know what changed before year-end, not afterward.

Chart of accounts examples for three small businesses
The template is only a starting point. Here’s how three different businesses would tailor their chart of accounts:
A solo marketing consultant. Revenue is split into retainers and project fees, since the owner wants to know which pays better. Cost of revenue covers freelance designers hired for client work. Operating expenses stay lean: software, advertising, professional development, home office and travel. Total: roughly 35 accounts.
An online store selling through its own site and a marketplace. Revenue is split by channel, because marketplace sales carry higher fees. Cost of goods sold separates product cost, inbound freight, packaging and outbound shipping. Merchant and marketplace fees have their own accounts. Inventory sits on the balance sheet, with an inventory adjustment account for counts and write-offs. Total: roughly 55 accounts.
A small electrical contractor. Cost of goods sold includes materials, subcontractors, job labor and equipment rental, while each job is tracked as a project instead of an account. Balance sheet accounts cover retainage receivable and vehicles. Payroll liabilities are broken out by tax because the business runs payroll weekly. Total: roughly 70 accounts.
In every case, the owner can answer their key question straight from the income statement without exporting anything: which service pays best, which channel earns more, which job turned a profit.
Who should own the chart of accounts
One person should control changes. In a small company that’s usually the bookkeeper or outside accountant, with the owner signing off on anything that affects how reports look. Anyone can request a new account, but they shouldn’t be able to create one directly in the software.
The point is consistency. When several people add accounts as they go, you end up with “Software,” “Software subscriptions” and “SaaS tools” all holding the same kind of cost, and every report needs cleaning before anyone trusts it.
Year-end: your chart of accounts and your accountant
Before your tax preparer begins, send three things: the current chart of accounts with any accounts added or deactivated during the year, the mapping of expense accounts to tax lines and a brief note on anything unusual, like a new revenue stream or a vehicle purchase.
That ten-minute handoff often heads off a round of follow-up questions. It also gives your accountant a chance to suggest changes for next year while the books are fresh and changes are easiest.
Common chart of accounts mistakes
- Too many accounts, particularly near-duplicates nobody can distinguish.
- A busy “miscellaneous” account, which signals the chart is missing something important.
- Mixing personal and business accounts in one set of books.
- Using accounts for locations or projects rather than classes or tags.
- Changing what an account means mid-year, which wrecks month-to-month comparisons.
Our Take / Expert Perspective
Our take: the chart of accounts is a small design choice with long-lasting effects. In our view, a big share of reporting headaches trace back to it: expenses scattered across five similar accounts, revenue lumped into one and a miscellaneous bucket nobody wants to open.
The best charts are designed backward from the questions. If you want marketing return by channel, you need separate accounts or consistent tags. If total marketing spend is all you care about, one account does it. Starting from the questions keeps the list short and useful.
Forecast, not fact: as more categorization becomes automatic, a lean, clearly named chart will matter even more, because automated rules learn from the account names and past coding they’re fed.
Our recommendation: keep your chart below 100 accounts, map every expense account to a tax line, push departments and locations into classes or tags and review the list every year at year-end close.
Frequently Asked Questions
What is a chart of accounts example?
A simple example includes accounts like 1000 Checking, 1100 Accounts receivable, 2000 Accounts payable, 3000 Owner’s capital, 4000 Service revenue and 6500 Rent. The template above shows a fuller version with roughly 40 accounts for a small business.
How many accounts should a small business have?
Most small businesses do fine with 40 to 100. Fewer accounts mean fewer coding errors; add one only when you need to see that item separately in your reports.
What is the standard chart of accounts numbering?
No legal standard exists, but a common convention uses the 1000s for assets, 2000s for liabilities, 3000s for equity, 4000s for revenue, 5000s for cost of goods sold and 6000s onward for expenses.
What is the difference between a chart of accounts and a general ledger?
The chart of accounts is the list of account names and numbers, while the general ledger records the transactions and balances in each of those accounts.
Can I change my chart of accounts later?
Yes. You can add, rename or deactivate accounts whenever you like. Merging or renumbering works best at the start of a fiscal year, with a record of the changes, so comparisons and tax mapping stay consistent.
Should the chart of accounts match my tax return?
It should map neatly to it, but it doesn’t need to copy it. Keep the detail you need for management, and make sure every account rolls up to a single tax line.
This article is for general information only and is not tax, accounting or financial advice. Consult a licensed CPA or financial professional for your situation.
Sources
- IRS: 2025 Instructions for Schedule C (Form 1040), checked November 7, 2026
- IRS: Recordkeeping for small businesses, checked November 7, 2026
- aiandblog: Claude for Excel for accountants and our Editorial Policy
Photos: path digital, Recha Oktaviani, Isaac Smith and Myriam Jessier on Unsplash.









Leave a Reply